Basic Print Condition Benchmark
The goal of this project is to evaluate printing devices across various printing technologies. This universal, fundamental concept allows for comparisons of even very different printers. It is also a tool for mass comparisons of printing devices, searching for groups of similar devices, creating distinct groups of similar devices, and finding devices that don't fit into any group. Based on a Minimal G7 control bar repeated nine times per sheet (three rows by three columns), it collects data from a print run. Within-page variation informs us about the uniformity of the page, and by comparing pages, we can understand the stability across the entire print run. Minimal G7, in addition to primaries and overprints, also includes tints and allows for G7 evaluation and assessment of TVI (dot gain). Statistics are key to accurate evaluation. Single-row Minimal G7 can be measured very quickly, and barcodes support additional descriptions. A large amount of data builds an image that eliminates the risk of random errors. Based on the E-Factor formula, which discards the worst 5% of results, the evaluation is precise. This is a unique method in the printing industry that allows for comparison of different printing conditions on other devices. The comparison chart shows not only the distance to the target—which in this case is set to GRACoL 2013—but also the distance between devices. The circles plot not only a point but also an area—because no device is perfectly repeatable, and the size of the circle is derived from the Variation E-Factor. Visually, we can see why two devices seemingly close to the reference print noticeably differ in reality.
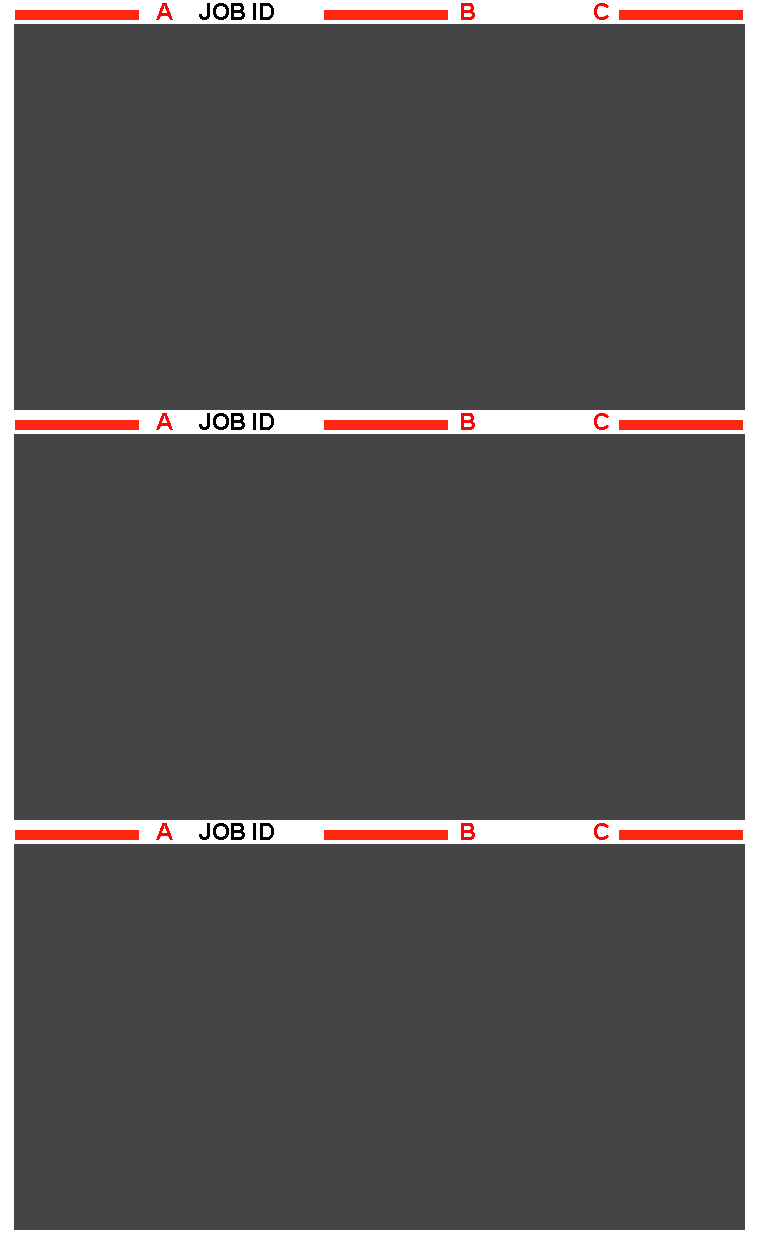
Minimal G7 Control Strip distributed across the sheet.
The best approach is to place in regular production - a dedicated print run is more expensive and may not reflect real production habits.

Minimal G7contains 21 patches, and it is generally a single row, but a 3-row version is also available.
Accuracy Server


